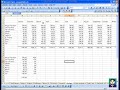
Graphing with Excel
tutorial excel
|
-
Actuellement 0.00/5
- 1
- 2
- 3
- 4
- 5
Note : 0.0 sur 0 votes
Commentaires (0)
|
| |
Description
How to use Excel to make a line graph, an xy graph, a bar graph or a pie chart. About my voice - I know it sounds weird. It's a microphone issue - everyone who knows me says it sounds nasally and not like me. If I put the mic farther away my voice sounds fine but then it is echoey. Some day I'll get something better than this $20 headset mic.
|
Mots-clés
|
|
Artiste : tutorial excel
Titre de la vidéo : Graphing with Excel
Catégories : Excel
Vues : 336
Ajouté par : admin
|


-
Soyez le premier à commenter cette vidéo.