How to graph and make charts with Excel video tutorial

tutorial excel

  • Actuellement 0.00/5
  • 1
  • 2
  • 3
  • 4
  • 5
Note : 0.0 sur 0 votes
Commentaires (0)
  X  


pub
 

Description

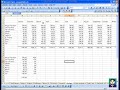
www.computertutorials.org Let say you have a set of data of beverage sales and you want to graph such data. This tutorial shows you how to figure out the average and the standard deviation of the data using formulas, and how to put those numbers into nicely formatted charts. Instruction on error bars are also included!

Mots-clés


Ajouter un commentaire

Nom :


Votre commentaire:


Confirmer:


* Merci de surveiller votre langage. 400 caractères maximum.

Commentaires

Soyez le premier à commenter cette vidéo.

Artiste : tutorial excel
Titre de la vidéo : How to graph and make charts with Excel video tutorial
Catégories : Excel
Vues : 274
Ajouté par : admin